Introduction
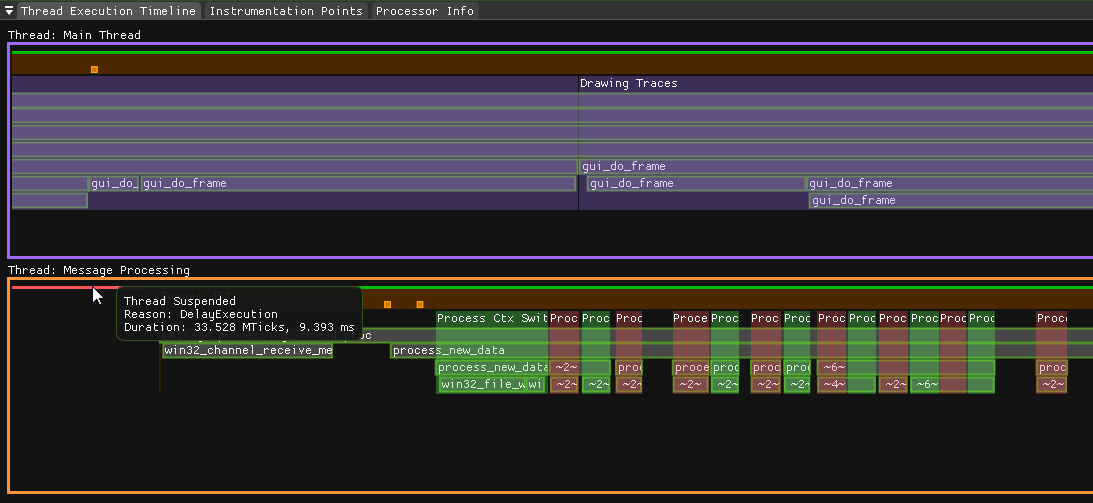
Vigil is a software-based instrumenting trace profiler, providing users the ability to inspect program execution after it has occurred. This allows for detailed analysis of application performance, and increased visibility into what’s occurring in their program. This project is very much a work in progress currently!
Vigil consists of a host application to inspect the execution of a client application, and a portable library (to be utilized by the client application) which interfaces with the host. The host application is written in C++, targetting high-performance desktop systems. It utilizes the ‘Dear ImGui’ library for the GUI (with DirectX11 for Windows), and everything else is written from scratch. The client library is written mostly in C with a sprinkling of C++ for some ‘quality of life’ features. The library is designed as a single header file to improve ease of integration into projects and source code management. It’s also designed to be interoperable across a wide range of platforms, compilers, and CPU architectures and designed to allow porting to new platforms with minimal effort or having to modify library internals. It is designed to be tuned by the user for a wide range of projects, from more constrained bare-metal platforms to high performance computing environments.
Demo
Motivation
Programmers may think they have a rough idea of how long a given piece of code will take to execute, but I think in reality most programmers have almost no idea. Also, if you don’t profile your code and profile it often, it’s very difficult to develop an intuition for the expected performance of a program as you are designing and implementing it. e.g., what types of constructs are fast or slow given your target machine, beyond algorithmic complexity types of analysis. Or, being aware when some system of your program begins exceeding a certain computational budget.
Another motivating factor is that, in my opinion, ‘printf’ style debugging is a superior debugging tool for majority of complicated bugs, especially when dealing with real-time systems, where line-step debugging may not always be feasible. This way, the developer is free to inspect execution after it has occurred. But, the tools we have as programmers today to facilitate this are extremely limited. At a relatively low volume of information, rudimentary ‘printf debugging’ becomes nearly untenable and takes a huge amount of time to untangle what actually occurred in the program. It also incurs a large overhead in developer time just to hone in on the section of code you might care about. For example, locating an issue via ‘binary searching’ source code with printf statements, which involves recompiling and rerunning your program many times before you can even begin taking a look at the issue itself. Then at the end, all of your instrumentation must be deleted, otherwise it may adversely contaminate the console or logs with indigestible information. Or even worse, given that print functions can take a long time to execute, they may directly interfere with the reproducibility of the bug you are trying to track down (So-called ‘Heisenbugs’)!
Vigil attempts to bridge these gaps by providing a low friction tool with the ability to markup your program (similar to printf style debugging) and be presented semantic visual information about its execution after it has occurred. Profiling can be an ongoing endeavour, working seamlessly in the background. I want a tool that integrates into my projects with very low friction, and is ready at the drop of a hat when something unexpected happens to help guide my understanding of a problem. I also want it to be ‘always on’ so that I can make constant corrections in my intuition for how ‘fast’ a piece of code is, or that my program is actually doing what I intend.
Features

Vigil provides visuals for the following information
-
How multiple threads are concurrently executing instrumented procedures
-
How long instrumented procedures take to execute and how they are being called relative to one another
-
When and why the program’s threads are switching contexts (e.g., waiting on a synchronization primitive, being preempted by the OS, etc.)
-
How the threads are being scheduled across logical cores
-
Heuristics for the performance of instrumented procedures
-
An abstract topological layout of the target machine, showing how cores and caches are related to one another

Trace data is stored to disk, and allows both live viewing of data as it’s being collected, or viewing the data ‘offline’, allowing comparisons of execution across multiple runs of the application. The data is also located in a single file for convenient storage.
The client library is designed to mitigate performance interference with the target application. It utilizes thread local trace buffers for full data partitioning between threads, minimizing contention to queue data for transmission. Trace data is designed to be directly serialized to the trace buffers, avoiding any additional data processing in the client application. It also employs a lock-free queue for queueing trace data to be serialized across the network, and lock-free cached memory pool allocators to avoid bulk copies of data when queueing for transmission. This way, the cost to queue data is extremely small and effectively passes ownership of memory blocks to an I/O thread, which will recycle the memory blocks back to the original thread’s possession after transmission. It also allows us to use an intrusively linked list queue implementation, circumventing issues related to fixed-size ring buffer queue implementations.
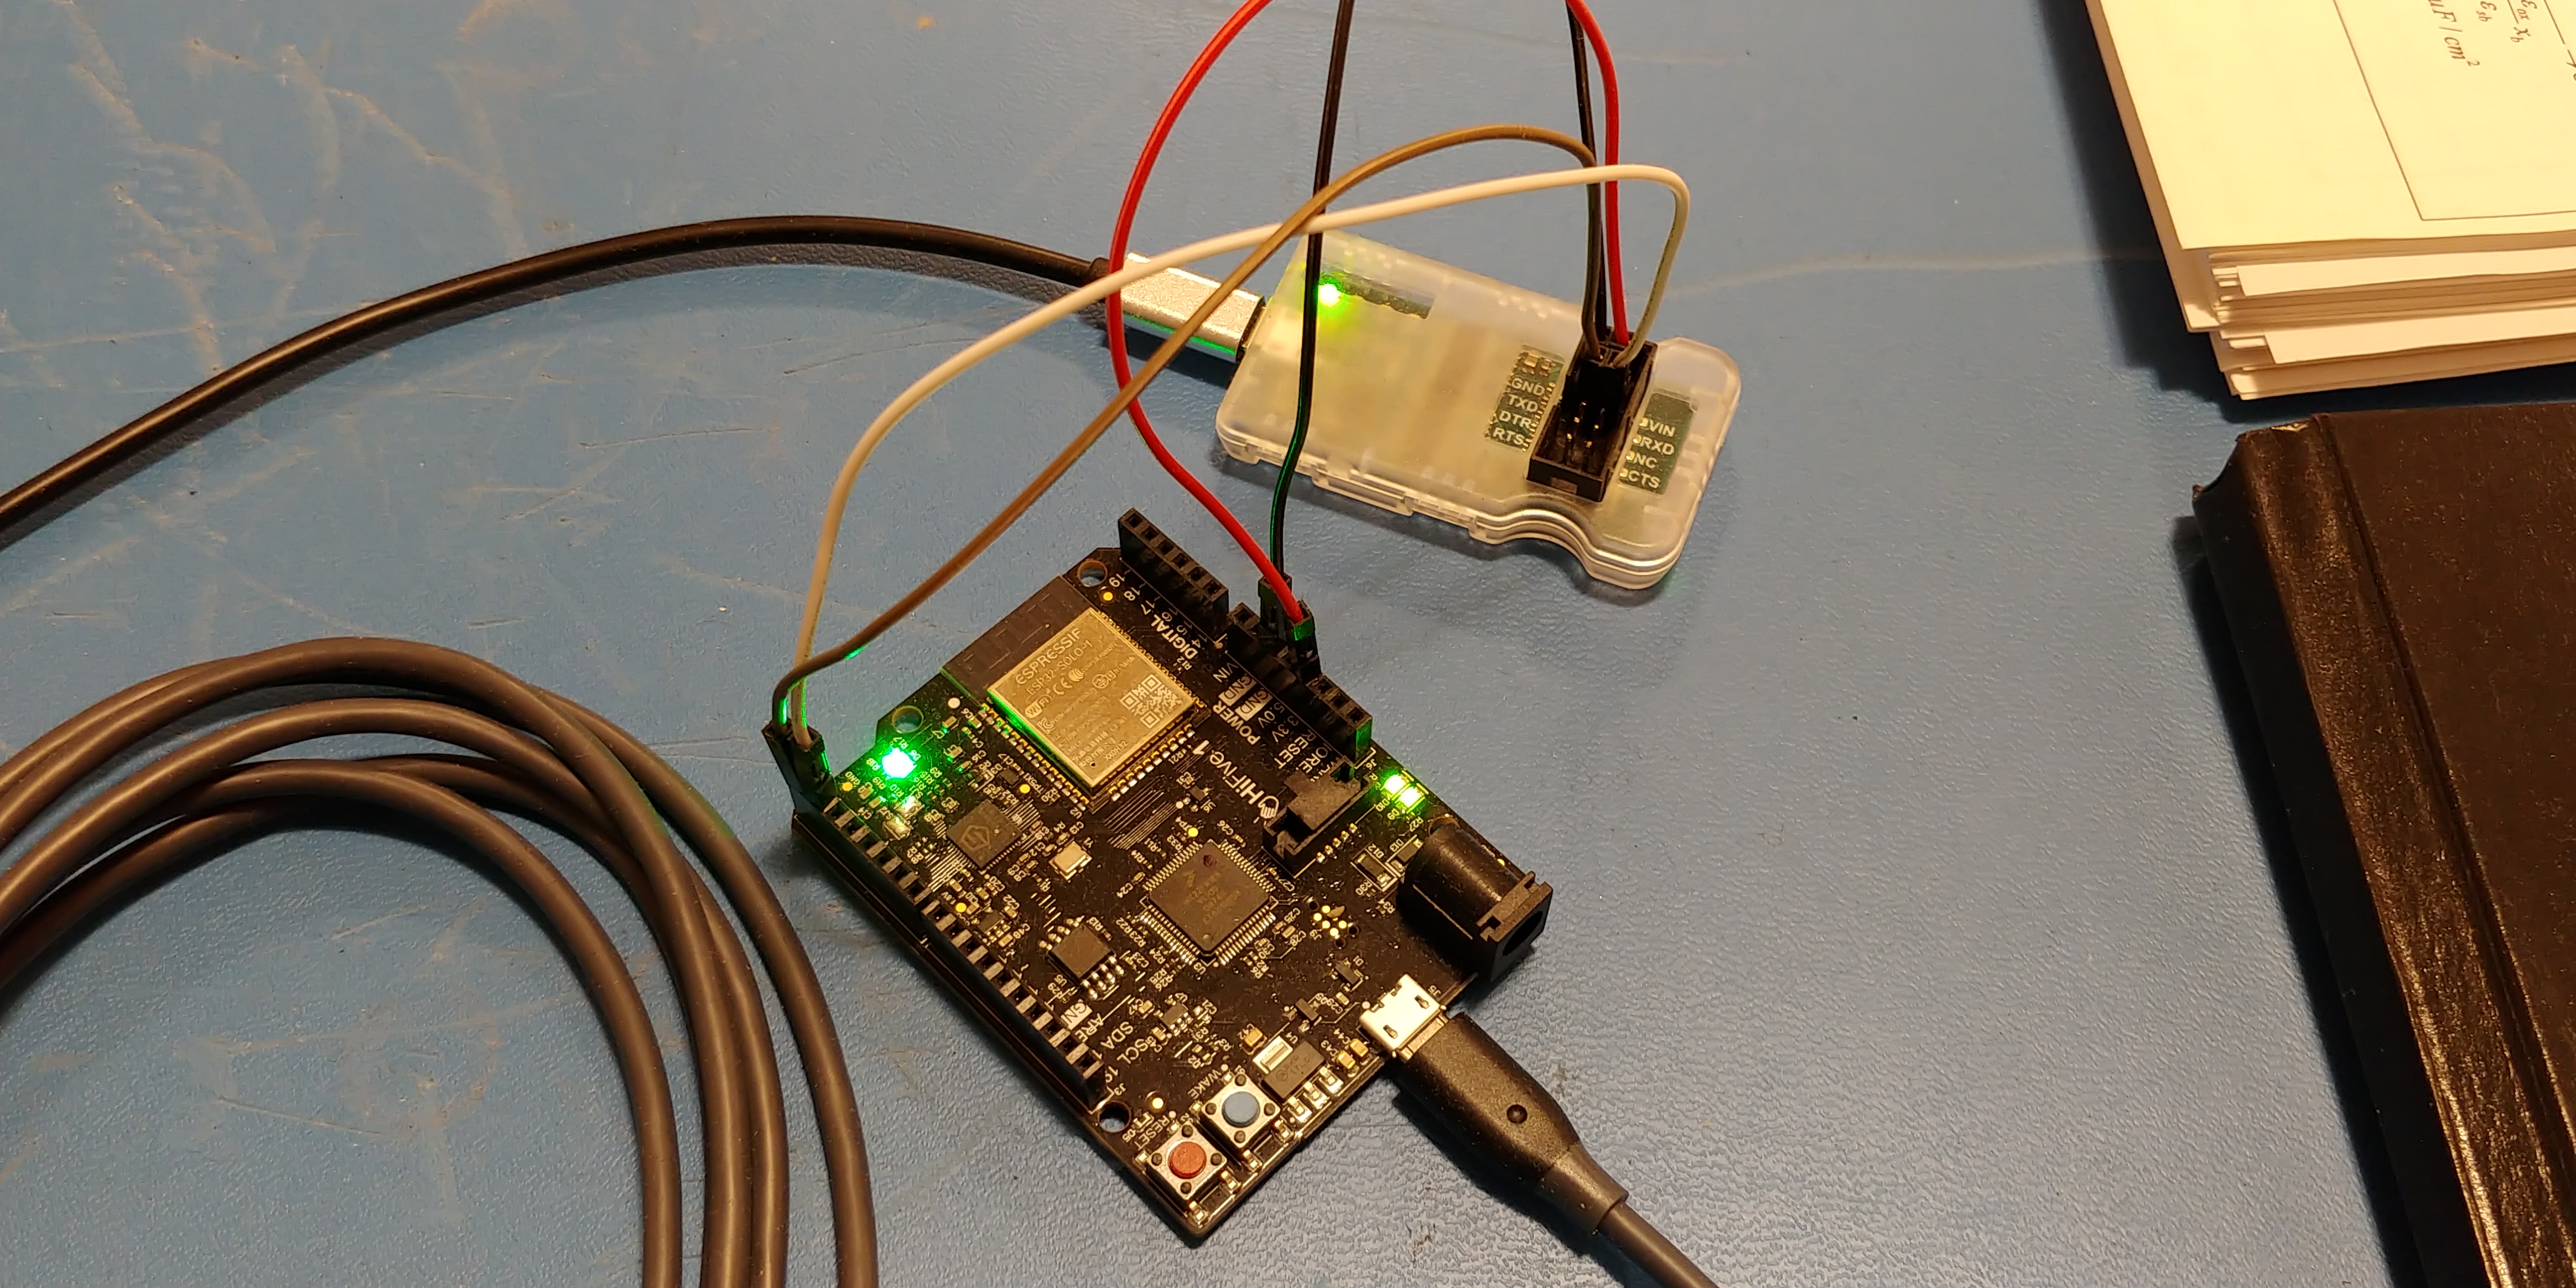
The client library is also designed to facilitate drop-in integration for projects written on platforms that are already supported (e.g., Windows) via a single header file. A minimal amount of work should be needed to port to new platforms, compilers, and architectures without having to modify internals of the library. It is currently interoperable with C99 and C++, and MSVC, GCC, and Clang compilers. As a proof of concept, I have a from scratch, free-standing/non-hosted, bare-metal RISC-V (not emulated) FreeRTOS project written in C using GCC, that incorporates this project, and transmits trace data over plain UART (and a serial to USB converter). It is also integrated inside the host application itself, compiling with MSVC and Clang, and interfaces via TCP. This demonstrates the portability of the library across CPU architectures, compilers, independence from libc/libstdc++, or a hosted system at all, and different types of streaming network interfaces.

Future Plans
I plan to continue working on this project, and hopefully by making thorough use of it, I will generate some new and exciting concepts to implement. Currently it feels a bit limited in its capabilities, but once I have a more solid technological foundation I plan on iterating heavily on the usability aspect, and turning it into a much more powerful tool.
Backend Technology/Networking
-
Data compression for network transmission and disk storage.
-
Binary data versioning for network transmission and disk storage.
-
Add shared memory Interprocess Communication (IPC) for applications running on the same machine.
-
Add Linux platform implementations both for the client library and the host application
User-facing Features
-
Source code view in host application, allowing one to directly view and jump to where instrumentation is located in the source instead of requiring user to interpret and translate the source location manually. Or perhaps a command interface to allow communication with text editors.
-
Optionally allow users to store a source code tree in a given trace session file, thereby versioning the data with the exact source code it came from.
-
Allow user to filter heuristics by a selected region in the timeline.
-
Add more detailed information to heuristics, and add additional statistical graphs etc for presentation.
-
Support for tracing multiple client applications concurrently (e.g., tracing networked client machines that are interfacing with one another.)
-
Support for viewing multiple sessions simultaneously, allowing users to inspect and contrast multiple runs of the program (e.g., comparing performance of a code change) without having to close and reopen each session over and over.
-
Allow tight integration of multiple sessions together to help facilitate these comparisons, correlate different runs, etc.